Reading your network reports
Every click and conversion lands in real time. Here's how to slice the data, read the columns, and export.
Updated 2026-06-09
Reports are where your network's activity shows up — clicks, conversions, revenue, payout, and margin, all read live from the edge's event store. You'll find them under Analyze → Reports.
Pick what you're looking at
The row of tabs at the top selects the report type:
| Report | Shows |
|---|---|
| Summary | Aggregated clicks → conversions → revenue → payout → margin. |
| Click detail | Every individual click, with its sub-IDs, geo, device, and result. |
| Conversion detail | Every conversion, with its transaction ID and the click it ties to. |
| Postbacks received | Inbound postbacks from advertisers (did the conversion fire?). |
| Postbacks sent | Outbound postbacks to publishers (did we tell them?). |
Group and filter
Below the report type, you control how the data is sliced:
- Granularity — Daily is the default. The table shows one row per day in your range.
- Group by — break the numbers out By publisher, By campaign, By advertiser, By geo, or by sub-IDs. This is how you answer "which publisher is actually converting?".
- Date range — pick a start and end date, then click Apply. The page notes the timezone the day-boundaries respect.
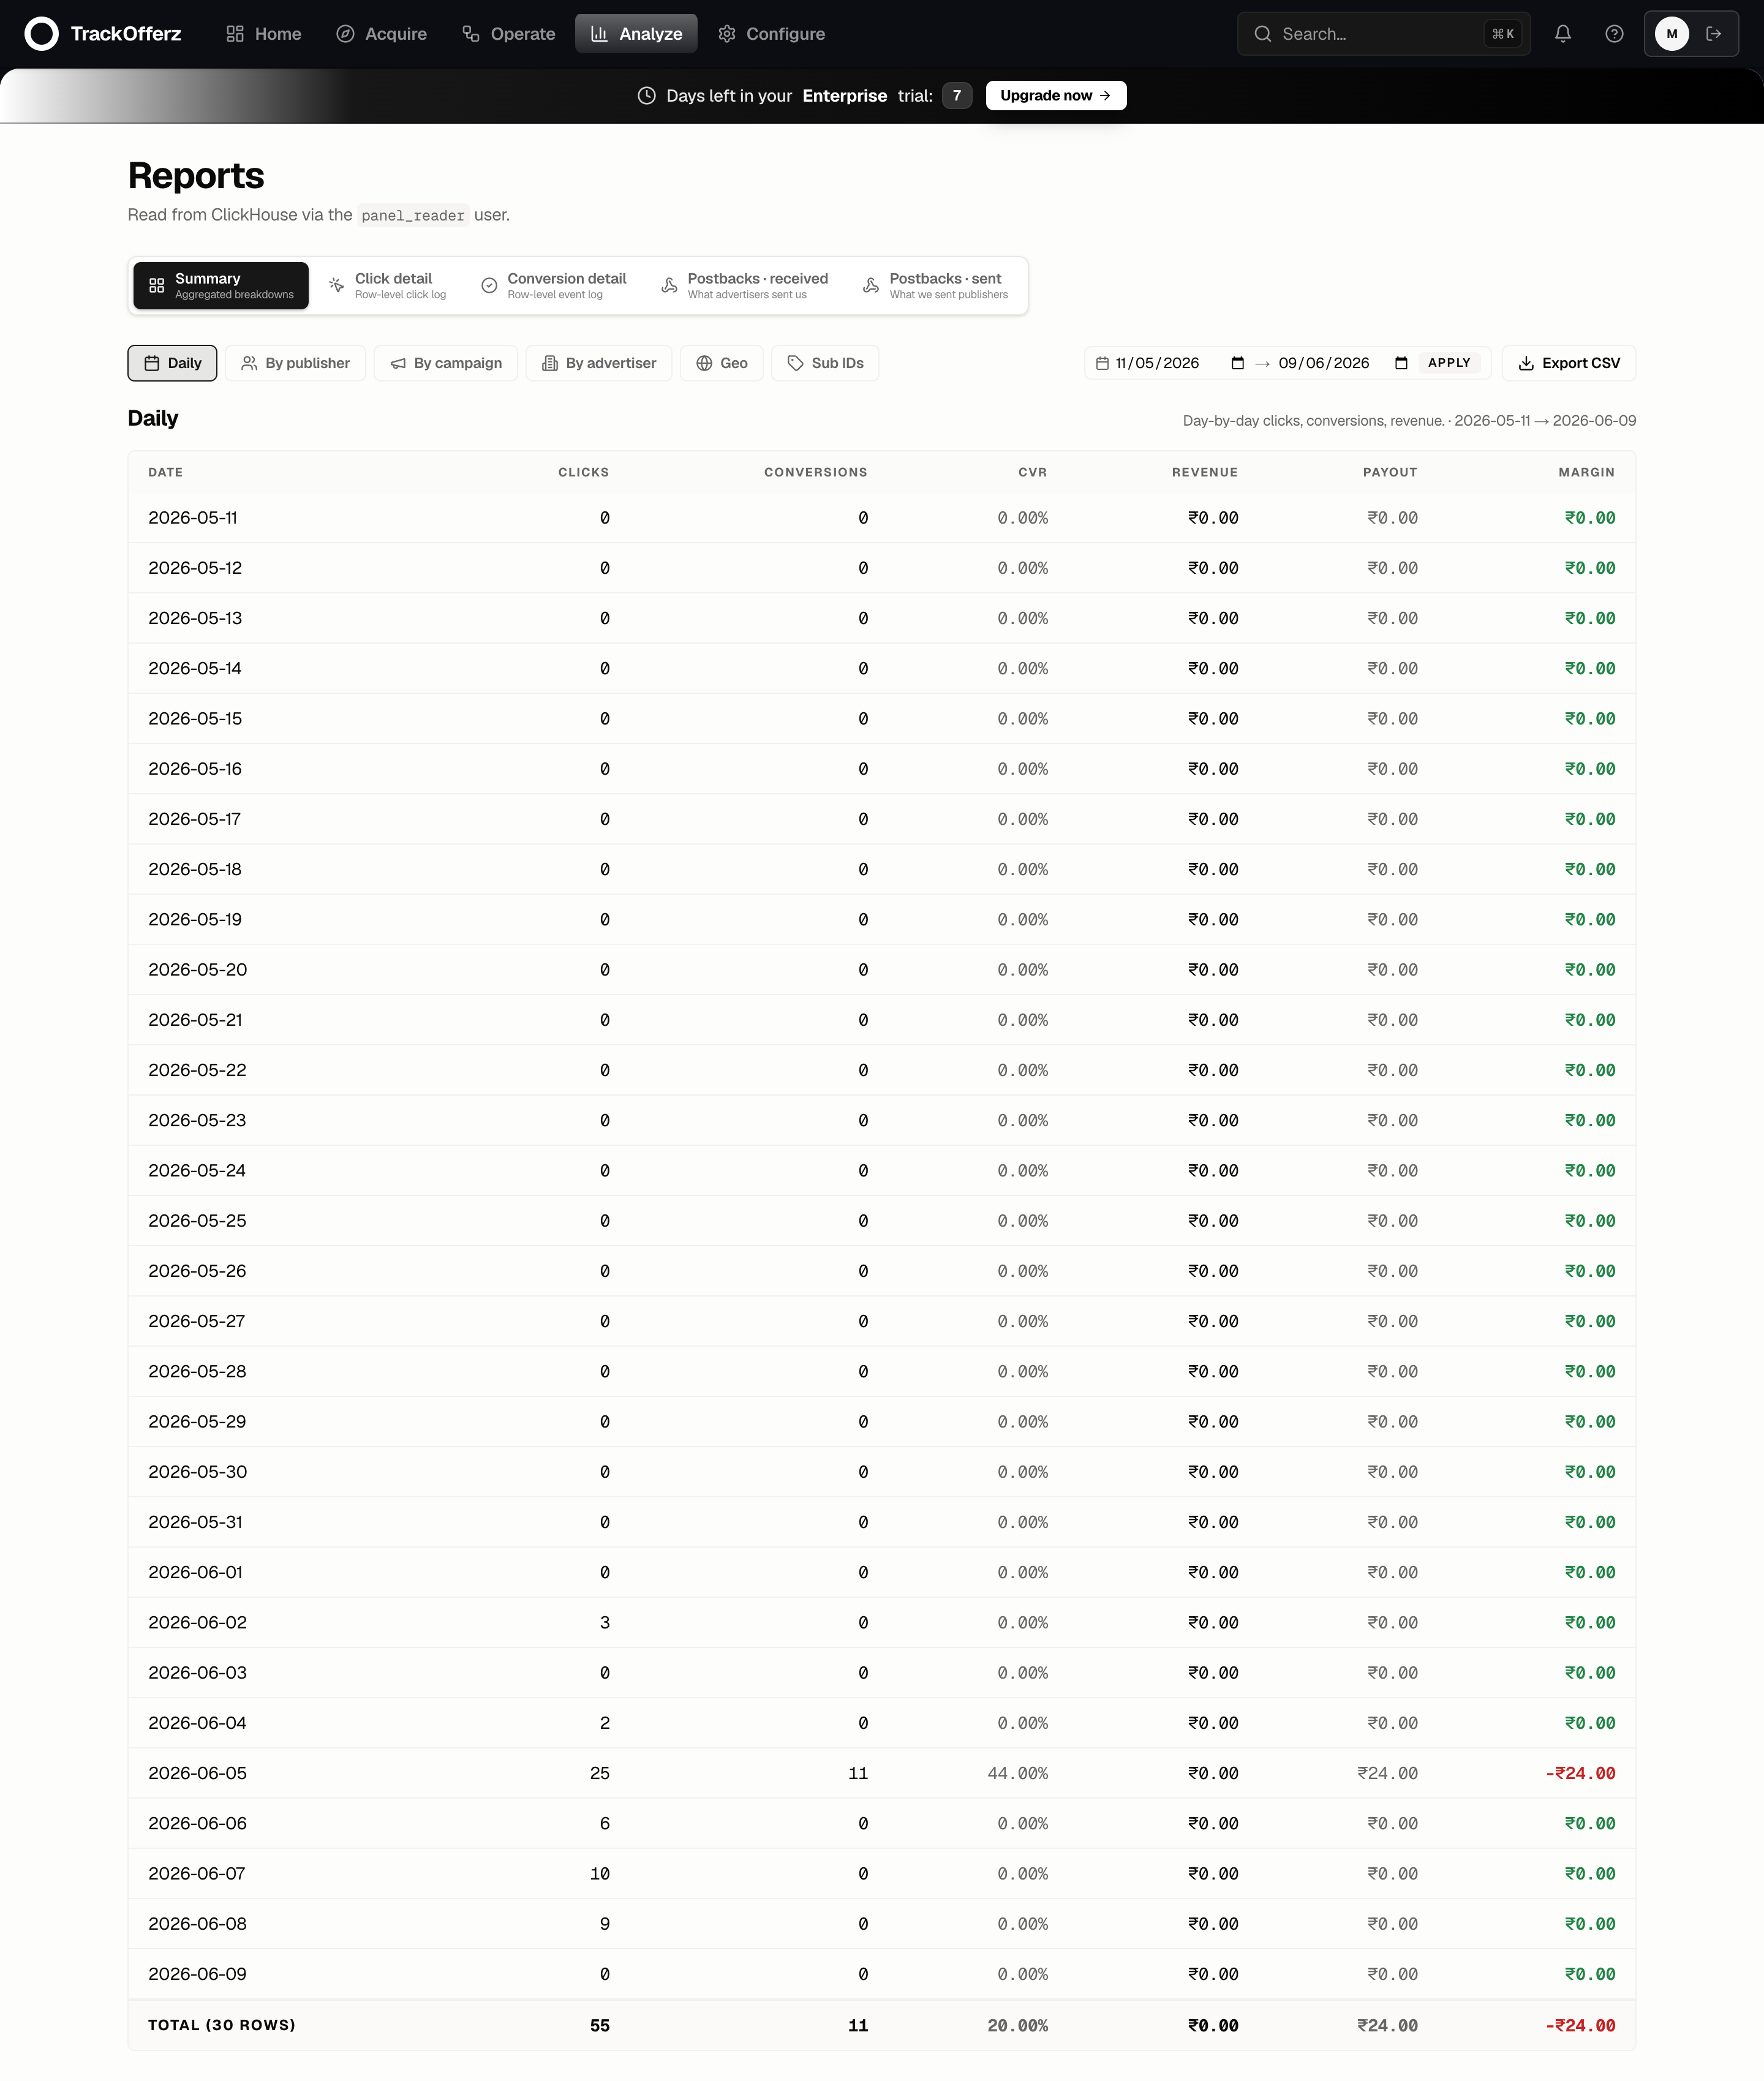
Reading the columns
The Summary report's columns, left to right:
| Column | Meaning |
|---|---|
| Clicks | Tracked clicks the edge accepted. |
| Conversions | Postbacks confirmed against those clicks. |
| CVR | Conversion rate — conversions ÷ clicks. |
| Revenue | What the advertiser owes you. |
| Payout | What you owe the publisher. |
| Margin | Revenue − payout. This is your take. Green is positive, red is negative. |
A negative margin (shown in red) means you're paying publishers more than the advertiser is paying you on that slice. That's normal while testing — but on live traffic it's the first number to watch.
Export
Click Export CSV to download exactly the rows and columns currently shown — same report type, grouping, and date range. Use it for invoicing, board decks, or pulling into a spreadsheet.
Why your numbers update instantly
Reports read from ClickHouse, the edge's event store, not from the panel database. Every click and conversion is queryable within about 50ms of happening — there's no nightly aggregation job and no sample rate. What you see is the whole truth, live.
If a conversion isn't showing, check Postbacks received first. If the inbound postback never arrived, the advertiser isn't firing it (or is firing it with the wrong transaction-ID macro) — the issue is upstream of your reports, not in them.